
Power Outage Analysis for Lodi, California (2020-2025)
Introduction
Lodi Electric Utility (LEU) maintains exceptionally high reliability standards, with outage durations 13 times shorter and frequency 7 times lower than national averages. Lodi Electric customers experience, on average, 0.13 outages per year, lasting an average of 20.3 minutes. This is significantly lower than the nationwide average of 1.44 outages and 123.49 minutes per outage. PG&E's 2024 Average was approximately 276.4 minutes per customer, indicating that the average PG&E customer experienced roughly 4.6 hours of sustained outages (lasting longer than five minutes) that year. Analysis of the past five years reveals specific seasonal patterns and geographic vulnerabilities, particularly during extreme heat events that stress both the electrical grid and transmission infrastructure. 12
Overall Reliability Performance
Lodi Electric Utility demonstrates outstanding performance metrics compared to PG&E and national standards:
Average outage duration: 20.3 minutes vs. 123.49 minutes nationally 2
Outage frequency: 0.13 outages per customer per year vs. 1.44 nationally 2
Energy transmission loss: 1.10% vs. 2.43% national average 2
Service territory: 14 square miles serving approximately 28,000 customers 3
Infrastructure: 315 miles of power lines maintained 1
Seasonal Outage Patterns
The analysis reveals distinct seasonal vulnerability patterns in Lodi's power system. Summer months (July through September) present the highest outage risk, with risk scores of 8-9 on a 10-point scale. This peak risk period coincides with:
Extreme heat events that stress electrical infrastructure
Maximum electrical demand from air conditioning loads
Wildfire season requiring potential Public Safety Power Shutoffs
Equipment fatigue from sustained high-temperature operation

Monthly Power Outage Risk Assessment for Lodi Electric Utility - Seasonal patterns show peak risk during summer months (July-September) when heat stress and maximum electrical demand coincide with wildfire season.
Winter months show the lowest risk (scores of 2-3), primarily due to mild Central Valley weather and minimal heating demands. Spring and fall present moderate risk levels (4-6) associated with weather transitions and planned maintenance activities.
Geographic Risk Distribution
Logo for Outage Map
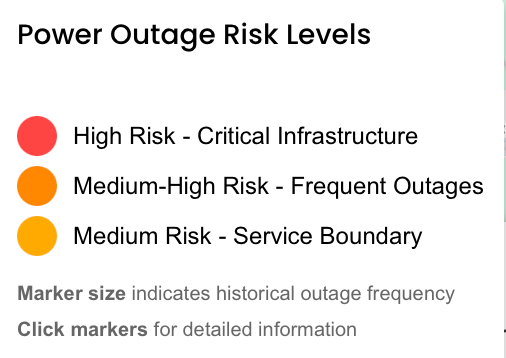
Geographic Distribution of Power Outage Risk Areas in Lodi Electric Utility Service Territory - Critical infrastructure locations (substations) show highest risk, while residential areas experienced the most frequent outages during the 2022 heat events.
The geographic analysis identifies two primary categories of outage-prone locations:
Critical Infrastructure Locations (High Risk)
Industrial Road Substation Area: Key distribution point requiring close monitoring
Guild Avenue Substation Area: Site of September 2022 relay failure that caused citywide rotating outages 45
Residential Impact Areas (Medium-High Risk)
Park West/Lodi West neighborhoods: Affected by both 2022 major outage events
Harvest Crossing/Bridgetown: Newer developments impacted during rotating outages
The eastern portion of Lodi (Lodi Avenue/Highway 99 corridor) represents the service territory boundary and has experienced recent isolated outages.67
Historical Outage Events Analysis
Historical Power Outage Timeline for Lodi Electric Utility (2020-2025) - Shows the three major documented outage events, with the September 2022 substation failure being the most significant in terms of duration and customer impact.
September 2022 Heat Wave Crisis
The most significant outage events in Lodi's recent history occurred during California's record-breaking September 2022 heat wave:
September 6, 2022 - Communication Error
Cause: Miscommunication between Northern California Power Agency (NCPA) and California Independent System Operator (CalISO)89
Impact: 1,372 customers in Park West, Lodi West, Harvest Crossing, and Bridgetown lost power for approximately 1 hour 5
Context: Part of statewide emergency response to prevent grid collapse during record heat 10
September 8, 2022 - Equipment Failure
Cause: Production relay failure on PG&E sub-transmission line serving Lodi 45
Impact: 6.5 hours of rotating outages affecting estimated 8,700+ customers citywide
Response: Required immediate 35MW load shed within 15 minutes to prevent total system failure 5
Infrastructure Vulnerabilities Revealed
The September 2022 events highlighted critical dependencies:
PG&E transmission reliance: Lodi depends on three PG&E sub-transmission lines for power import 4
Single point of failure: Loss of one transmission line required immediate load shedding due to insufficient redundancy 4
Communication protocols: Misunderstandings between grid operators can trigger unnecessary outages 8
Mitigation Measures and Future Planning
State Emergency Power Plant Project
In response to the 2022 outages, California and Lodi approved construction of a 20-48 MW emergency natural gas power plant to provide backup power directly to the city, eliminating dependence on PG&E transmission during emergencies. This facility will operate only during emergencies and was completed in the summer of 2023.4
Wildfire Mitigation
LEU maintains comprehensive wildfire mitigation plans, though the utility operates entirely within Tier-1 (lowest fire threat) areas according to CPUC Fire Threat Maps. The service territory has no areas designated as High Fire Threat Districts.111 2
Planned Infrastructure Upgrades
PG&E's Northern San Joaquin 230kV Transmission Project is expected to enhance regional transmission capacity by 2028, including the construction of new switching stations and the upgrade of transmission lines serving Lodi.4
Recommendations
Immediate Actions
Enhanced monitoring of substation relay systems, particularly during extreme heat events
Improved communication protocols with CalISO and NCPA to prevent miscommunication-related outages
Proactive customer notifications before implementing load shedding procedures
Long-term Strategic Planning
Accelerate emergency power plant construction to reduce transmission dependence
Expand distributed energy resources including customer solar installations and battery storage
Climate adaptation measures for equipment rated to handle increasing summer temperatures
Seasonal Preparedness
Summer readiness campaigns emphasizing conservation during peak heat events
Pre-positioned repair crews during high-risk periods (July-September)
Enhanced coordination with regional water and emergency services during extended outages
The data demonstrate that while Lodi Electric Utility maintains exceptional baseline reliability, climate change and regional grid dependencies present ongoing challenges that require proactive infrastructure investment and emergency preparedness planning.
Sources
1: https://findenergy.com/providers/city-of-lodi-electric/power-outage/
2: https://www.lodi.gov/931/Public-Safety-Power-Shutoff-Information
3: https://poweroutage.us/area/county/2925
4: https://www.lodi.gov/915/Power-Outage
5: https://www.pge.com/outages
6: https://experience.arcgis.com/experience/7387a5f1b6f24e778f5ab9d2b9a1d3f8
7: https://poweroutage.us/area/state/california
8: https://www.pge.com/en/contact-us/report-an-issue/report-electric-issue.html
9: https://gis.data.ca.gov/maps/CalEMA::power-outages-by-county
10: https://lodi411.com/lodi-eye
11: https://pgealerts.alerts.pge.com/outage-tools/outage-map/
12: https://data.ca.gov/dataset/power-outages-by-county
13: https://data.ca.gov/dataset/power-outage-incidents
14: https://www.socalgas.com/sites/default/files/2025-07/2025-CA-Gas-Report-FINAL.pdf
15: https://www.youtube.com/watch?v=5tQ1vsotksE
18: https://www.sjgov.org/department/envhealth/public-safety-power-shutoff
19: https://www.lodi.gov/352/Electric-Utility
21: https://weatherspark.com/s/1142/3/Average-Winter-Weather-in-Lodi-California-United-States
22: https://findenergy.com/providers/city-of-lodi-electric/
23: https://www.lodi.gov/AlertCenter.aspx
24: https://efiling.energysafety.ca.gov/eFiling/Getfile.aspx?fileid=56619&shareable=true
25: https://www.lodi.gov/949/Wildfire-Mitigation-Plan
26: https://www.cpuc.ca.gov/consumer-support/power-outage-maps
27: https://www.ssjid.gov/wp-content/uploads/2020_UWMP_SSJID.pdf
29: https://centralcalifornia.org/power-play-state-plans-to-build-emergency-power-plant-in-lodi/
31: https://www.lodi.gov/CivicSend/ViewMessage/message/181075
32: https://www.lodi.gov/AlertCenter.aspx?AID=POWER-OUTAGE-466
34: https://news.yahoo.com/thousands-lodi-lose-power-unnecessarily-195600920.html